25 Vital eCommerce Metrics Every Store Owner Needs to Track
These days, setting up an eCommerce site is as easy as making a toast.
Running a profitable eCommerce site though; well, that’s a whole other beast.
Good business owners know data. Smart business owners know how to take data and make business decisions based on it.
Speaking of, we’ve put together the 25 eCommerce metrics you need to know if you hope to run a profitable eCommerce store that goes beyond the basics.
Each one is interconnected, and they’re all important in making your store not just workable, but as profitable as it can be.
We’ll go from simple to complicated, just so our beginner readers’ heads don’t start spinning right away. Read on.
In a hurry? Here are 25 vital eCommerce metrics you need to track:
Metrics vs. KPIs: What’s the Difference?
Before we begin discussing the most important metrics to keep track of with regard to your eCommerce business, we need to answer one major, overarching question:
What’s the difference between a metric and a key performance indicator?
Perhaps the best way to begin explaining the difference between the two is to say that all KPIs are metrics - but not all metrics are KPIs.
All KPIs are metrics - but not all metrics are KPIs.
Of course, this statement needs a bit of unpacking in order to truly make sense of it.
To break this down a bit further, metrics are objective data points that simply “exist,” while KPIs are metrics that hold subjective value to your company - and provide insight into how well your business is performing in a certain area.
When we say that metrics simply “exist,” we mean that they have no “So what?” value to them. In other words, you can’t just look at a metric and say for sure whether it means good or bad things in terms of your company’s performance - if it means anything at all.
In fact, problems can arise when a company mistakenly derives satisfaction from so-called “vanity metrics” that really don’t matter all that much to the company’s bottom line. For example, a sharp increase in pageviews might “feel good,” and make your team feel as if things are going well; however, if this increased visibility doesn’t lead to an increase in sales - and it wasn’t a result of a specific marketing initiative - then it’s really nothing to get excited about.
Key performance indicators, on the other hand, are measured objectively - but assessed subjectively.
In contrast to basic metrics, KPIs do answer the aforementioned “So what?” question. In other words, gaining an understanding of a KPI as it stands, as compared to your company’s goals related to said KPI, tell you whether or not you’ve been successful in a given venture or initiative.
To truly understand the relationship between basic metrics and KPIs, it can be helpful to think of them as having a degree of separation - with your company acting as a “filter” of sorts between the two.
Revisiting the pageviews example from above, if a true correlation can be drawn between an increase in pageviews and an increase in sales numbers, it’s certainly worth digging deeper into how the two relate to one another. If you determine that the increase in pageviews is at least partly responsible for an increase in sales, you might define “X sales per Y pageviews” to be a KPI worth keeping track of.
Before moving on, it’s worth pointing out that all of this is not to say that metrics aren’t important; they are. While KPIs, by definition, indicate a company’s level of performance in a specific initiative, the metrics associated with a given KPI provide the hard evidence needed to come to a conclusion regarding this level of performance.
Key Performance Indicators by Funnel Stage
In this section, we’re going to dig into a discussion of some of the key performance indicators that are typically used by eCommerce businesses when focusing on different parts of the sales funnel.
Quick note: We also have a guide on other digital marketing metrics and KPIs.
Since we’ll be providing concrete examples of KPIs (as opposed to the more hypothetical ones we mentioned above), we hope to hammer home the notion that the importance of a given KPI is derived specifically from the initiative being focused on at the moment. In other words, a KPI related to generating visibility most likely wouldn’t be considered a KPI related to sales numbers. Again, this will become clearer as we go on.
That said, without further ado, let’s dive in.
eCommerce Metrics Related to Site Visitors
One of the initial (and even ongoing) goals for an eCommerce business is to generate visibility and brand awareness among your target customers.
Moreover, you’ll not only want to get your brand noticed, but you’ll also want to get people to actually click over to your site, with the hope that they become even more engaged in the near future.
That said, here are some of the KPIs to pay attention to when focusing on first-time visitors:
[Metric #1] Impressions
An impression refers to a single instance in which an ad or piece of content created by a company, presented on a third-party platform, is presented to an individual.
Impressions are noted in a few different ways, such as:
- The number of times a given link appears as a search result
- The number of times an ad is displayed on Facebook, Instagram, etc.
- The number of times a sponsored ad appears on a third-party site (or as a paid search result)
The number of impressions you generate can help you understand, for example, whether your content marketing and SEO initiatives have been successful, whether you’re bidding on the right keywords, or whether your ad bid is high enough for a specific search term.
However, impressions and visibility are only the tips of the iceberg…
[Metric #2] Click-Through Rate
As we said earlier, simply getting your brand noticed is one thing - but getting consumers to actually click over to your site is much more important.
That said, you’ll want to keep track of your click-through rate (CTR) for each channel your content or ads are visible on. This is done by dividing the number of individuals who clicked on your ad or link by the total number of impressions said ad or link generated. For example, if 1,000 people see your ad, and ten of them click on it, your CTR would be:
10 / 1,000 = 0.01, or 1%
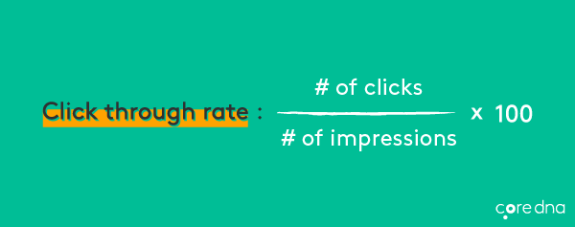
Whereas impressions give you an idea of how often your ads or content are seen, CTR provides a bit more insight into how engaging said ads or content actually are - in that those who click on the ad or content are likely interested in learning more about what your company has to offer.
You also want to pay attention to which specific pages your visitors click over to most often once they’re actually on your site. Typically, you’d want more people to check out your category and product pages than, say, your About Us page; if a discrepancy between these numbers becomes apparent, you’ll want to dig deeper to figure out where the problem may lie.
Side note: Impressions and CTR are the basic KPIs to keep track of in terms of who’s clicking over to your site. In a later section, we’ll revisit metrics related to visitors who click over to - and stick around on - your site.
eCommerce Metrics Relating to Mailing List Subscribers
Having a mailing list allows you to continuously engage with consumers who have shown an active interest in your brand’s offerings - whether they’ve actually made a purchase or not.
Needless to say, you’ll want to keep track of a number of different metrics relating to this list.
[Metric #3] Subscription Rate
Simply put, your subscription rate is the percentage of individuals who sign up for your mailing list after visiting your site, compared to the total number of visitors your site has generated.
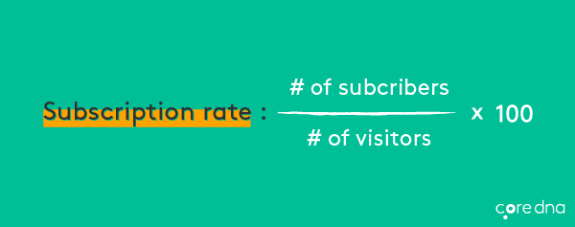
If your subscription rate is lower than you’d hoped, you’ll want to experiment with tactics such as implementing popups, streamlining the subscription process, optimizing your CTA, and improving your newsletter’s value proposition.
[Metric #4] Email Open Rate
As the name implies, your email open rate refers to the number of times a given email is opened on your recipient’s end, compared to the total number of people the email was sent to.
There are a number of factors that can affect open rate, such as:
- Email subject line
- How your company/name appears in the “From” field
- The time of day you send the email
- The day of the week you send the email
Additionally, a low open rate over an elongated period of time may be a sign that you need to clean up your mailing list by deleting subscribers who haven’t opened your emails in a long while.
[Metric #5] Email Click-Through Rate
Going a step further, email click-through rate refers to the number of individuals who clicked the link(s) included within a given email, as compared to the total number of people you sent the email to.
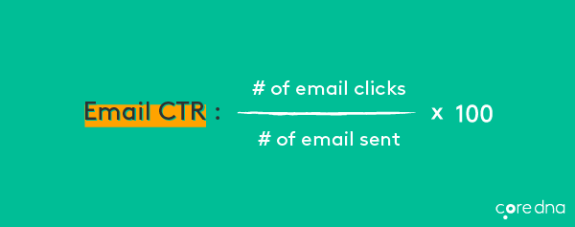
Since, of course, an individual must open the email in the first place in order to click the link included within, the above factors also influence email CTR. Additionally, email CTR is affected by the content of the email (both in terms of the copy/text, as well as any multimedia which may be included), the value provided by the email (and the promise of value provided by the linked content), and the email’s call-to-action.
[Metric #6] Unsubscribe Rate
Your mailing list unsubscribe rate is calculated as follows:
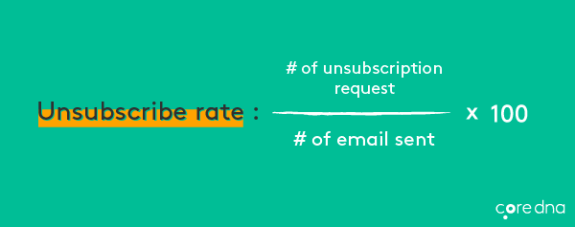
(Number of unsubscription requests / Number of emails sent) x 100
On the surface, your unsubscription rate gives you an idea of how effective and valuable your newsletters and drip campaigns are to your audience.
However, digging deeper, you might find that those who have unsubscribed did so for a variety of other reasons that don’t necessarily reflect negatively on the value of your content. For example, perhaps they subscribed in order to gain access to a specific piece of content (such as an ebook), but realized your content simply wasn’t for them.
With that in mind, a high unsubscribe rate may be a sign that you need to be more clear on your website in explaining who, exactly, would benefit from signing up for your mailing list.
[Metric #7] Spam Complaint Rate
Spam complaint rate is calculated in the same was as unsubscribe rate, of course substituting the number of unsubscribers with the number of spam reports.
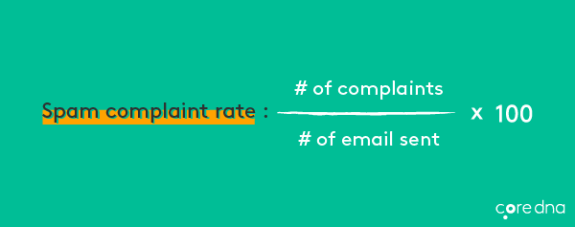
Needless to say, you want to keep your spam rate as low as possible (below 0.1%, hopefully).
While some spam complaints may be made when a simple unsubscribe would suffice (i.e., the recipient sends the email to spam rather than unsubscribing), a higher-than-normal spam complaint rate may be a sign that your emails actually resemble “typical” spam in some way - and are therefore seen as annoying and/or worthless in the eyes of your recipients. Of course, this means you’ll need to go back to the drawing board to figure out exactly what the problem could be.
[Metric #8] List Growth Rate
List growth rate is calculated using the following formula:
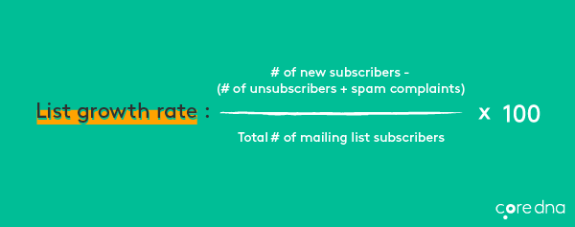
([(Number of new subscribers) - (Number of unsubscribers + spam complaints)] / Total number of mailing list subscribers]) x 100
Whew.
To simplify all that, you basically want to look at how many subscribers you currently have, as compared to the number of subscribers you had at the beginning of a designated time period (be it the past month, quarter, or year).
A lower-than-expected list growth rate can potentially be attributed to...well...most everything we’ve spoken about so far, from impressions and CTR to the value provided via your actual emails. Needless to say, you’ll need to dig much deeper to determine the true source of the issue, here.
[Metric #9] Conversion Rate
Email conversion rate refers to the percentage of email recipients who not only clicked-through to your website via an email, but who also completed a specified task while on-site.
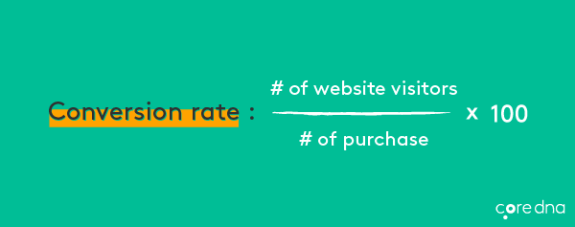
For example, if an email is promoting an offer for 20% off a specific product, and included a link to the actual product page, a conversion would be defined as instances in which recipients went through with the purchase.
A quick note: Here’s a good example of a case in which a metric can be seen as a KPI in one aspect, but as a vanity metric in another. The goal of such an email would be to increase conversions - meaning conversion rate is the focused-on KPI. That said, even if the open rate of said email was an astounding 100%, this stat would be pretty meaningless if it didn’t result in an increase in conversion rate.
Monitor these metrics closely, and pivot when necessary.
eCommerce Metrics For Shoppers/Browsers
As mentioned earlier, it’s important to take note of how your visitors act once they’re actually on your website.
[Metric #10] Add to Cart Rate
Add to cart rate tells you what percentage of your visitors actually added a product to their virtual shopping cart.
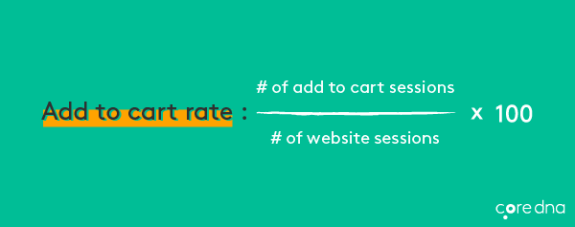
Your add to cart rate can tell you a few things, such as:
- Whether you’re attracting the right audience
- Whether your visitors come to your site with a specific purpose in mind (or if they’re “just looking around”)
- Whether your products and/or prices meet your target consumers’ expectations
[Metric #11] Time on Site and Pageviews per Visit
In terms of what they mean and how to calculate them, these metrics speak for themselves.
However, one thing to note is that higher-than-average time on site and pageviews per visit doesn’t necessarily mean good things.
Yes, on the one hand, getting your visitors to stick around - and click around - for a decent amount of time clearly means your site is engaging, and that your visitors find your products to be potentially of interest; but if they’re spending too much time clicking around without making a purchase, it may be a sign that your site confuses them or causes them to hesitate in some way or another.
[Metric #12] Bounce Rate
Bounce rate refers to the percentage of visitors to your site who navigate away from it after only visiting one page.
In contrast to the above metrics, a high bounce rate essentially means that the content on the specific page in question isn’t very engaging and/or valuable to the individual who landed on it.
Usually, a high bounce rate is a byproduct of a discrepancy between the expected value of a site (which the visitor gleans from the ad or search result data associated with the site) and the actual value and relevance of the site once they click over to it.
eCommerce Metrics For Buyers/Customers
Now let’s take a look at the most important metrics dealing with those who have actually made a purchase from your online store.
[Metric #13] Conversion Rate
In this sense, a conversion rate refers specifically to the percentage of individuals who have made a purchase from your site, as compared to the overall number of visitors to your site.
As this metric is rather straightforward, we need not say much else except that your goal should be to increase your conversion rate by any means necessary...that is, as long as it’s in a cost-effective way, of course.
[Metric #14] Average Order Value
Average order value (AOV) refers to the average amount of money your customers spend in a single transaction.
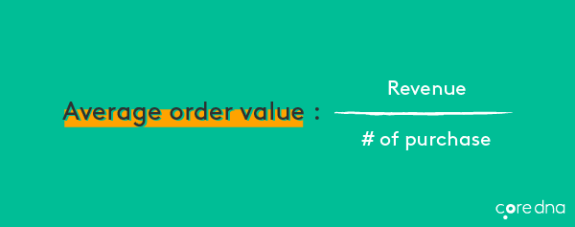
Whereas conversion rate tells you how many of your visitors end up making a purchase, AOV tells you how much revenue is generated through each of these purchases. That said, the case may very well be that you have a high conversion rate, but a not-so-profitable average order value; on the other hand, your conversion rate might not be on-par with your industry’s standard, but you might be generating enough revenue through each transaction to make up for this discrepancy.
[Metric #15] Revenue Per Visitor
Revenue per visitor (RPV) differs from AOV in that it considers all visitors to your site, rather than just those who have made a purchase.
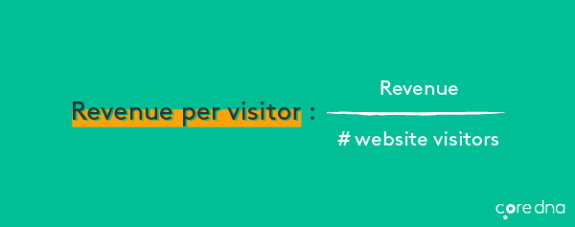
Remember earlier on how we spoke about a hypothetical connection between pageviews and sales numbers and/or revenue? RPV is where these all align. By discovering your average RPV, you can essentially assign a dollar amount to every visitor who clicks over to your site - whether they make a purchase or not.
(Note: Again, this doesn’t necessarily mean that increasing your visitor numbers will definitely increase your revenues. More accurately, your RPV can tell you whether or not you’re attracting the right consumers via your ads, content, etc.)
[Metric #16] Cart Abandonment Rate
Unfortunately, not everyone who loads up their virtual shopping cart will end up going through with their purchase as originally intended.
Cart abandonment rate, then, refers to the percentage of individuals who place an item in their cart but fail to make a purchase (compared to the total number of customers who add an item to their cart and make a purchase, in addition to those who added an item but did not make a purchase).
Okay, that explanation probably made things a bit confusing. Let’s just look at the formula:
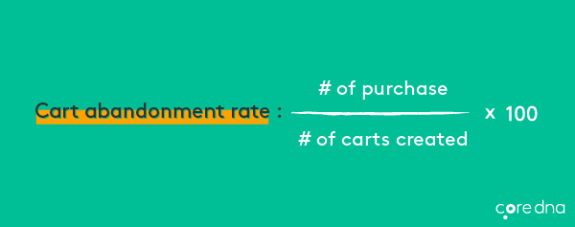
(Number of people who abandoned their cart) / (Number of people who added items to their cart, whether they made a purchase or not)
As a simple example, say ten people add items to their cart, and only three end up going through with a purchase. That leaves seven cart abandoners - meaning your cart abandonment rate, in this example, is 70%.
While cart abandonment rates are typically rather high (actually around that 70% mark), the reasons for abandonment range from logistical issues relating to shipping and payment processes, to more out-of-your-hands factors such as your potential customer becoming distracted with “real life” issues, etc. At any rate, if your cart abandonment rate creeps over 70-80%, you’ll want to take a closer look at the possible reasons for such.
[Metric #17] Customer Acquisition Cost
Customer acquisition cost (CAC) compares the amount of money your company has spent for marketing purposes in a given period to the number of customers you’ve brought in over that same period of time.
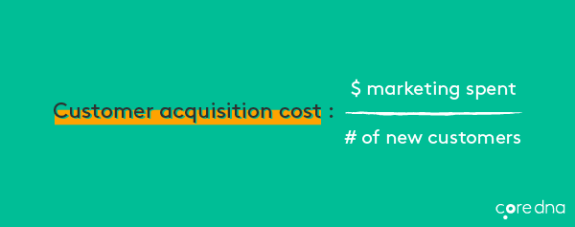
While your CAC can provide insight into the effectiveness of your marketing initiatives when compared with your CAC from previous months, quarters, or years, it definitely leaves a lot of information up in the air, so to speak. For example, a CAC of $25 can be incredible if your AOV is $500; but if your AOV is $30, this CAC would certainly be considered way too high.
And, as we’ll get to in the next section, there are a number of other metrics to check out when considering what a “good” CAC is for your company.
eCommerce Metrics For Repeat Customers
As you probably know, your repeat customers are really where the money is. Here are the metrics you should be tracking with regard to them.
[Metric #18] Retention Rate
Your customer retention rate refers to the percentage of customers you keep on board over a given period of time.
The formula for calculating retention rate is:
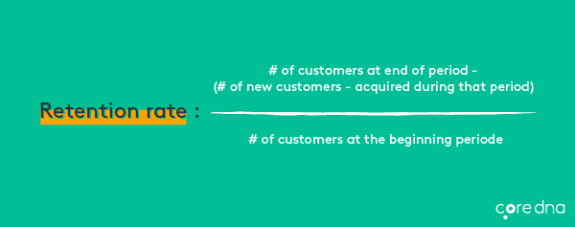
[(Number of customers at end of period) - (New customers acquired during that period)] / (Number of customers at the beginning of period)
The reason you subtract the number of new customers you gained is that these customers are...well...new. They haven’t been around long enough to be considered “retained,” yet.
As we mentioned above, there’s an inherent cost in acquiring new customers; however, the cost of keeping customers is much lower than this initial cost. That said, it’s essential that you focus on keeping your retention rate as high as possible at all times.
[Metric #19] Customer Lifetime Value (CLV)
Customer lifetime value refers to the average projected revenue you expect your typical customer to provide over the course of their “lifespan” with your company.
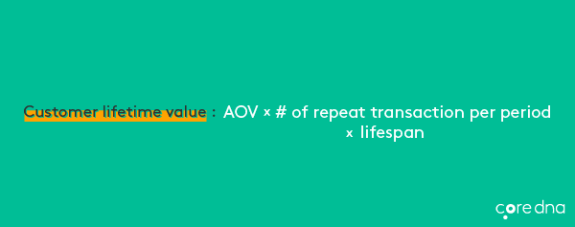
Nailing down CLV is a bit convoluted (and is explained quite well by Neil Patel in this infographic), but it essentially involves taking into consideration:
- Your AOV
- Your average customer’s purchase frequency
- The average lifespan of your customers
All things considered, the purpose of tracking CLV makes sense: the more your customers spend - and the more often they make purchases - the better off your company will be.
[Metric #20] Early Repeat Rate
Early repeat rate refers to the percentage of first-time customers who make an additional purchase in a relatively short period of time, as compared to the total number of first-time customers in that cohort.
Note: This period of time depends on a variety of factors, such as the type of products a company offers. For example, a sneaker retailer might consider three months to be “early,” while a company that sells consumables might define “early” as two to three weeks.
Identifying and learning about your early repeat customers can provide you with a ton of insight regarding the needs of those who will almost certainly prove to be your most valuable consumers moving forward. In turn, you can focus your future marketing initiatives specifically on catering to these individuals.
[Metric #21] Repeat Customer Rate
Repeat customer rate tells you, quite simply, what percentage of your total customer base has made more than one purchase from your store in their lifetime.
Repeat customer rate is calculated as follows:
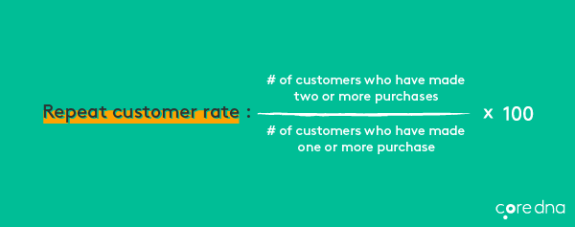
(The number of customers who have made two or more purchases) / (The number of customers who have made one or more purchase)
Similarly, to our explanation of early repeat rate, a “good” repeat customer rate depends on your industry. For example, a company that sells wine glasses will almost certainly have more repeat customers than a company that sells engagement rings.
At any rate, as we said when discussing CLV, it’s incredibly beneficial to your business to keep first-time (and long-time) customers on board for as long as you possibly can.
eCommerce Metrics For Raving Fans
Now we’re talking about the real money-makers for your company.
Not only do your raving fans provide a large chunk of your overall revenues, but they also spread the good word about your brand and get others in their network to hop on board, as well.
That said, here are the metrics to keep track of regarding these loyal customers.
[Metric #22] Net Promoter Score
Your Net Promoter Score (NPS) tells you how many of your customers would be willing to recommend your brand to someone in their network.
NPS is determined by asking your customers the following question:
“On a scale of 0-10 (10 being most likely), how likely are you to recommend our brand to someone in your network?”
Once you generate a significant amount of responses, you then categorize them as follows:
- Those who responded 0-6 are defined as “Detractors”
- Those who responded 7-8 are defined as “Passives”
- Those who responded 9-10 are defined as “Promoters”
You then calculate the percent of Promoters, as well as the percent of Detractors, as compared to the entire surveyed population. Then, you subtract the percent of Detractors from the percent of Promoters. So, if 60% of your respondents are considered Promoters, and 20% are considered Detractors, your NPS would be 40. You’d then compare this number to the average within your industry to see how your company stacks up against your competition in terms of raving fans.
(Note: In addition to the quantitative data that your NPS provides, you can also ask an open-ended follow-up question, such as “Why did you respond the way you did?” or “What would we need to do for you to increase your rating?”)
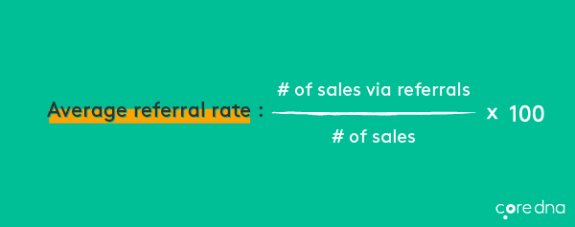
[Metric #23] Average Referral Rate
(Note: The final three metrics we discuss here assume you have some sort of referral program in place.)
Average referral rate refers to the percentage of purchases made directly due to referrals, as compared to the total number of purchases made, within a given period of time.
[Metric #24] Program Participation Rate and Share Rate
Your program participation rate refers to the percentage of individuals who have signed up for your referral program, compared to the total number of customers you’ve reached out to with regard to the program.
Your program share rate, then, refers to the percentage of advocates who share information about your company, as compared to the total amount of people who signed up for the program. In other words, you’re looking to see what percentage of those who signed up actually follow through with making a referral.
These two metrics can tell you whether or not your referral program is seen as valuable and/or engaging by your long-time customers - and whether or not they believe your brand is worth mentioning to their friends and family members.
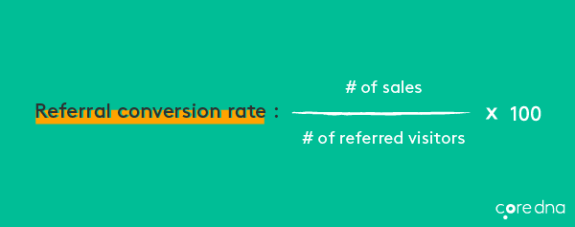
[Metric #25] Referral Conversion Rate
Finally, referral conversion rate, of course, refers to the percentage of referred individuals who take action (i.e., make a purchase from your store) as compared to the total number of individuals your raving fans attempted to refer.
Obviously, this metric gives you a good idea of how effective your referral is at generating new business. If it’s lower than expected, you have a few questions to consider, such as:
- Have you made it easy for your referrers and their referred friends, etc. to engage with your program?
- Have you made clear to your referrers the “type” of individuals they should be referring?
- Have you provided proper incentives for each party, in order to increase their likelihood of participating in the referral program?
Finally (and this could perhaps be an entire article unto itself), you want to consider the ROI of your referral program - especially if your conversion rate is high. Simply put, you may find that you’re sinking too much investment into the various aspects of your program (e.g., marketing content, incentives, etc.), and not making near as much in return as you thought you would. At that point, you’ll simply need to go back to the drawing board and figure out how to continue offering your referral program in a more cost-effective manner moving forward.
Conclusion
Now that you know what metrics to track, you can start making smarter decisions.
No more pushing campaign blindly. No more overstocking products.

Sam Saltis is the founder and CEO of Core dna, a digital experience platform (DXP) that helps digital teams build and optimize complex, dynamic websites with less code than ever before. Sam has more than 30 years’ experience building technology solutions for various industries and sectors, such as government, business and tourism.
He leads a team of technology experts who share his vision of empowering clients to harness the Internet to scale their businesses and enhance their relationships.


